About Ecommerce Charts Examples
Ecommerce charts focus on turning raw sales, revenue, and conversion data into visual insights that are easy for product and marketing teams to act on. In a modern analytics dashboard, these components highlight key performance indicators such as average order value, repeat purchase rate, and funnel drop-off, all within a layout that stays consistent with the rest of your design system. When built with shadcn ui primitives, shadcn blocks, and tailwindcss utilities, ecommerce chart sections feel cohesive alongside tables, filters, and summary cards in a next.js application.
From an implementation standpoint, EcommerceCharts components are usually composed of a chart canvas wrapped in a strongly typed react shell. TypeScript interfaces define the structure of series, labels, and time ranges, while props control configuration such as comparison periods or currency formatting. The outer layout might use shadcn ui components like cards, tabs, and dropdown menus to switch between metrics and segments without reloading the page. This approach keeps the visualization logic isolated while still making it easy to reuse the same chart presets across multiple views, from high-level executive overviews to granular product-level reports.
In a next.js setup, the surrounding copy and structure of ecommerce charts can be server-rendered for better SEO and initial load performance, while the interactive chart itself is hydrated on the client. That means search engines still see meaningful headings, descriptions, and contextual information around the visualization, even if the data updates in real time after hydration. By standardizing these sections as shared react components backed by typescript and styled with tailwindcss, teams can maintain a consistent analytics experience across the product while keeping the codebase organized and scalable.
Which Ecommerce Chart Example Should You Pick?
The four charts answer different questions about a store. Pick by the metric you need to show.
- Revenue by device: Ecommerce Chart 1 compares desktop and mobile revenue per month in a grouped bar chart. Ecommerce Chart 2 shows daily revenue for one series at a time with toggle buttons in the header.
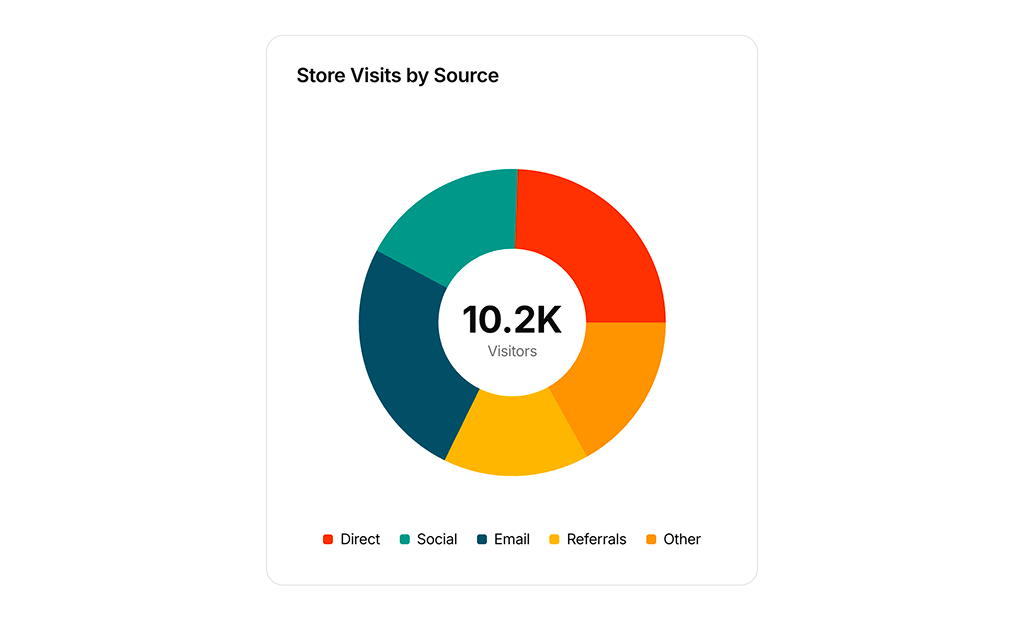
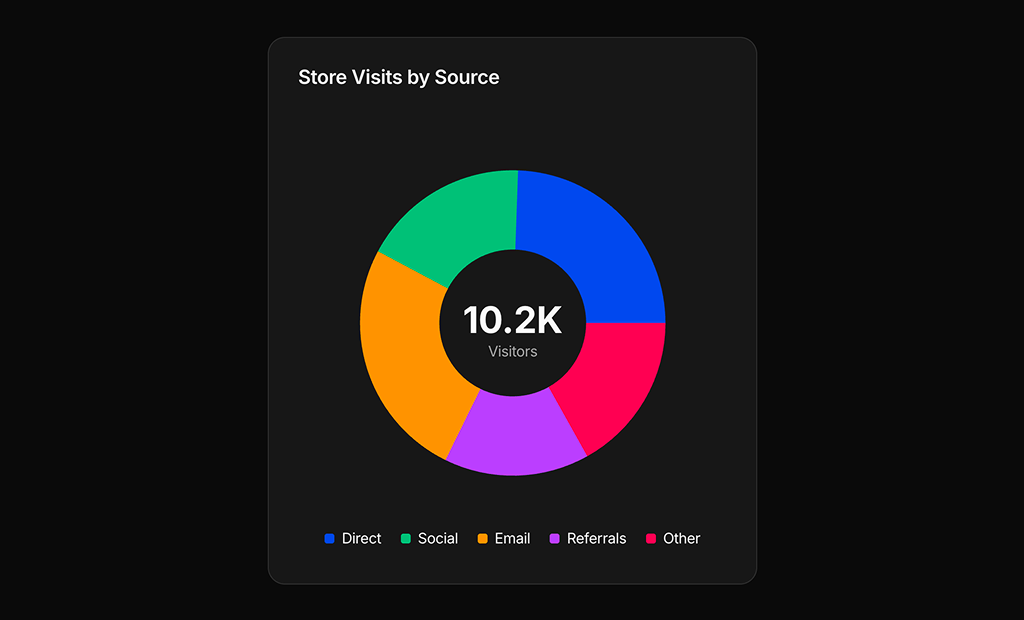
- Traffic sources: Ecommerce Chart 3 splits store visits by source in a donut chart with a center total and a legend.
- Trend with KPI: Ecommerce Chart 4 pairs a returning rate value and change badge with a twelve month line chart and an actions menu.