Shadcn Charts Examples
Browse 10 Charts examples for shadcn/ui, including ecommerce charts, line charts, project management charts. Preview each example live, then copy and paste the code or install it with the shadcn CLI. Built with shadcn/ui, Tailwind CSS and React.
Shadcn Chart Examples for Dashboards and Reports
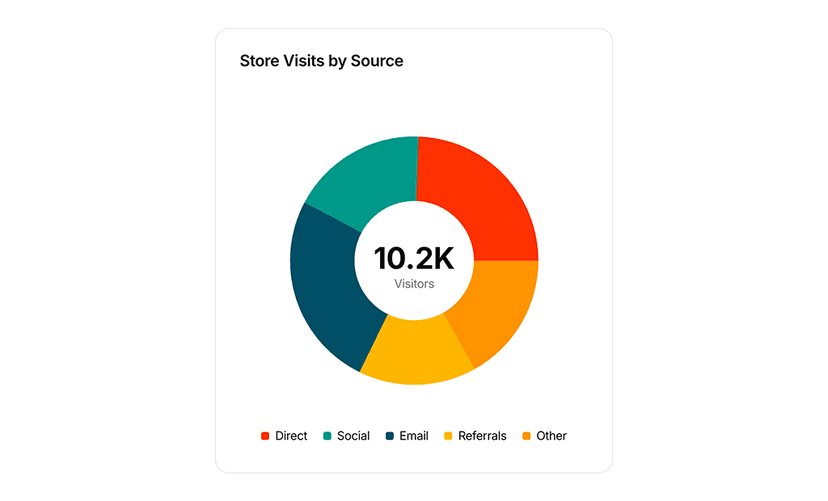
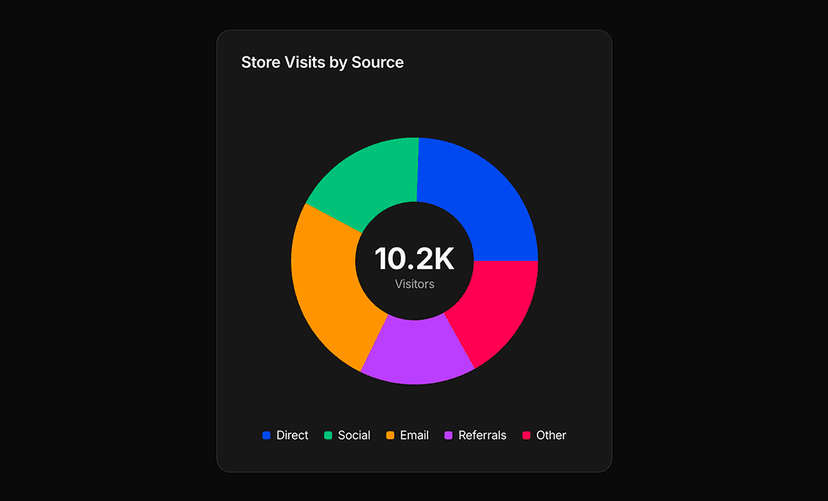
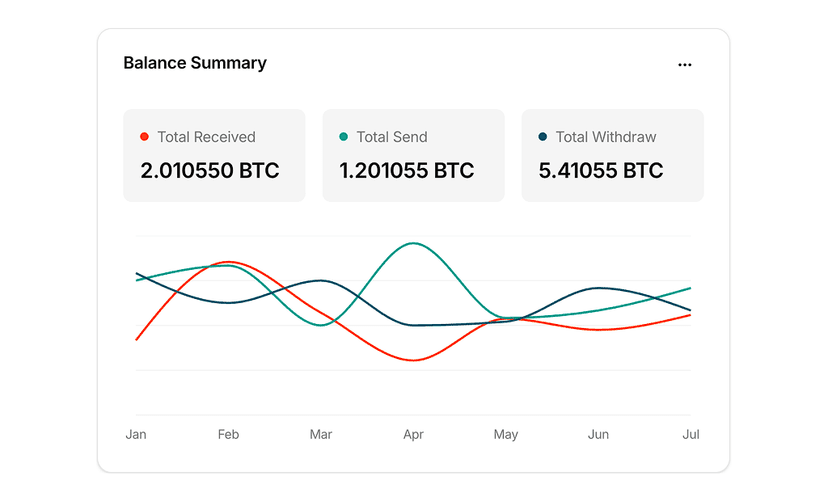
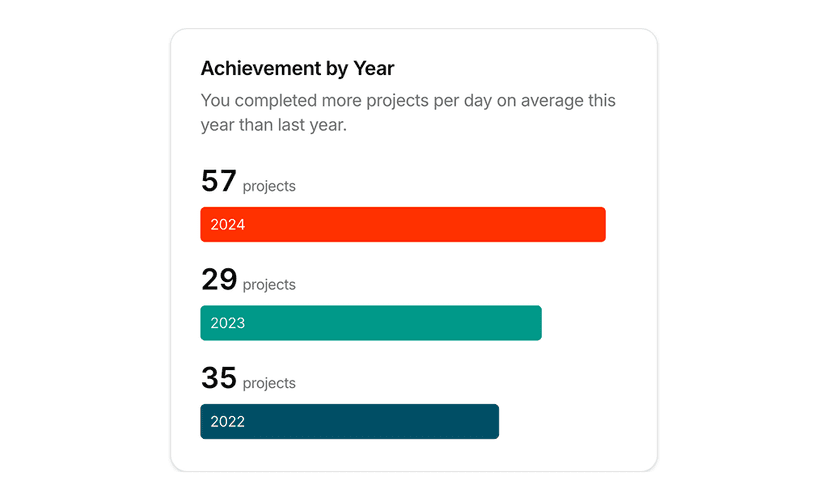
Chart examples show real dashboard scenarios built with the shadcn/ui chart component and Recharts: ecommerce charts for revenue and orders, line charts for trends and project management charts for progress and workload. Every example uses theme aware colors and responsive containers.
What You Get With Chart Examples
- Ecommerce analytics: Sales, revenue and conversion charts with period comparisons and summaries.
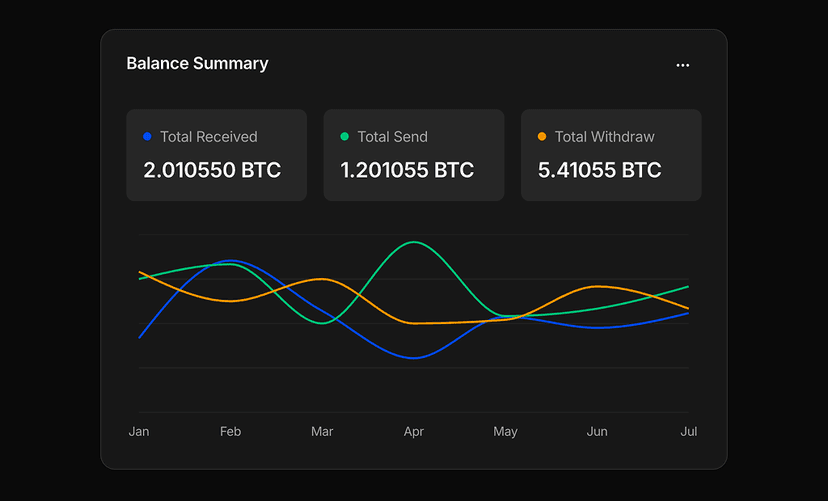
- Trend lines: Line charts with multiple series, gradients, dots and interactive tooltips.
- Project tracking: Project management charts for task completion, sprint velocity and team capacity.
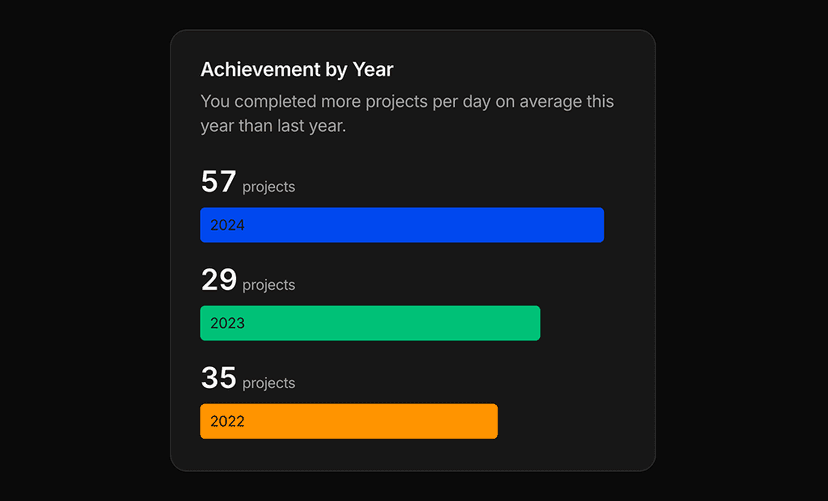
- Theme aware colors: Charts read colors from CSS variables, so they follow your theme and switch between light and dark automatically.
- Responsive containers: Every chart sits inside a responsive container and scales with its card, from mobile widgets to full width reports.
Charts That Match Your Design System
Charting libraries rarely match a product's visual language out of the box. These examples wrap Recharts in the shadcn/ui chart component so axes, tooltips and legends inherit your fonts, radius and colors.
For standalone chart sections see the chart blocks, or start from a complete admin dashboard template.