Shadcn Gantt Chart Blocks

Gantt chart blocks built with shadcn/ui and the Kibo UI Gantt component: product roadmaps, project schedules and team resource planners with drag to reschedule, markers, grouping and detail panels.

Gantt Chart 1 Pro

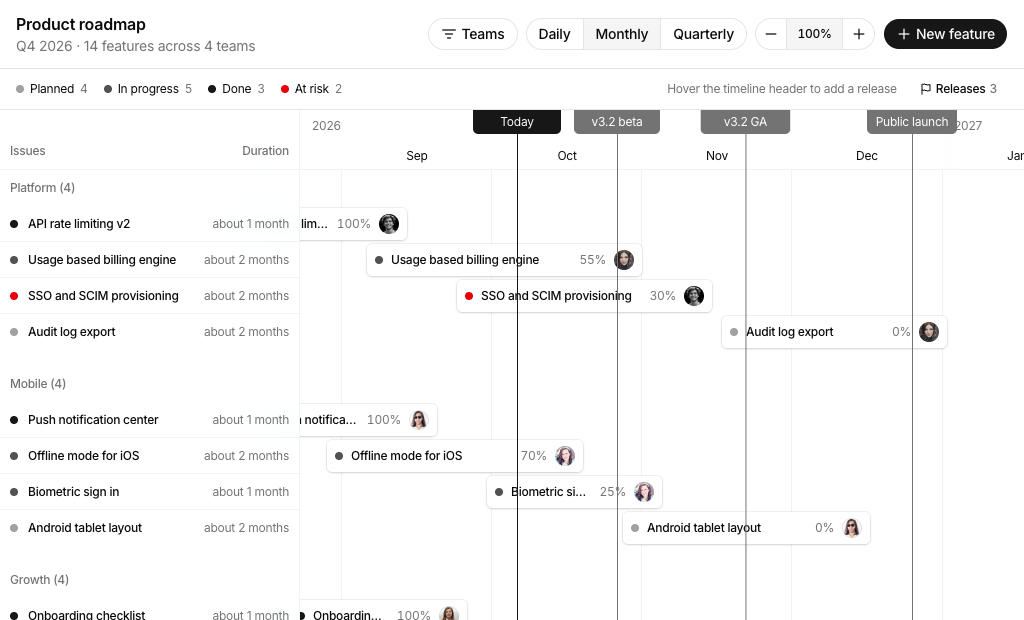
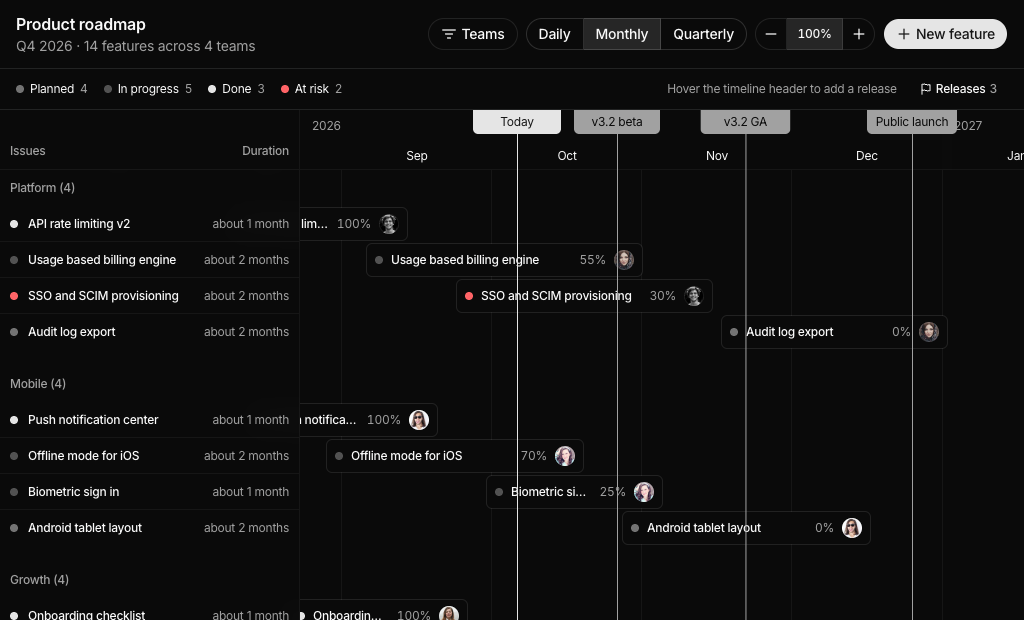
Product roadmap timeline grouped by team with a team filter, Daily, Monthly and Quarterly scales, zoom, release markers, draggable feature bars and a side sheet for editing status, owner, dates and progress.

Gantt Chart 2 Pro

Construction schedule grouped by phase with overall progress, overdue counts, task search, assignee filter, scale and zoom controls, draggable task bars, milestones, an add task dialog and an edit sheet.

Gantt Chart 3 Pro

Team resource planner with one lane per person grouped by department, monthly load badges, client filter, project and time off bars with hours per day, an assignment popover and an Assign work dialog.

About Shadcn UI Gantt Chart Blocks

A gantt chart lays work out on a calendar as bars, so teams can see what happens when, what overlaps and what is running late. These three shadcn gantt chart blocks turn that idea into full screens: a product roadmap grouped by team, a construction schedule grouped by phase and a resource planner with one lane per person.

Like the rest of our shadcn blocks, they are written in React and TypeScript and styled with Tailwind CSS. The timeline is the Kibo UI Gantt component, and everything around it is made of shadcn ui components such as Toggle Group, Button Group, Select, Dialog, Sheet, Popover, Calendar and Avatar. Status colors come from your theme tokens, so the bars match your shadcn components in light and dark mode.

Key Elements of a Gantt Chart

  • Time scale: a header with days, months or quarters and a way to switch and zoom it.
  • Grouped bars: items organized by team, phase or person, with a name, owner and progress on the bar.
  • Today line and markers: a clear line for the current date and labeled milestones or releases.
  • Status legend: a color for planned, in progress, done or blocked work, always paired with a text label.
  • Editing: drag to reschedule and a detail panel or popover for dates, owner and progress.

Where and Why to Use Gantt Chart Blocks

Timelines are among the hardest views to build well: date math, drag handles, scrolling to today, grouping and forms that keep start and end dates valid. These shadcn ui blocks handle that work and keep the interface consistent with the rest of your Tailwind CSS app, so you can focus on connecting real projects and people.

  • Product roadmaps: share upcoming features by team and release date with stakeholders.
  • Construction and field projects: schedule phases, track progress on site and flag late tasks.
  • Agencies and consultancies: book staff on client projects and avoid overloading anyone.
  • Event and campaign planning: line up preparation tasks against a fixed launch or event date.
  • Internal tools: add a timeline tab to a project management or PSA product.

Gantt Chart Blocks in This Collection

  • Gantt Chart 1: Pick it when product managers need to show which team ships what and when, and want to filter teams and edit a feature without leaving the roadmap.
  • Gantt Chart 2: Made for day level project control, where a site manager searches tasks, filters by assignee and needs late work to stand out.
  • Gantt Chart 3: Answers “who is free next month?” for agencies and service teams, with monthly load per person and leave shown in the same lane.

Similar Block Categories

  • Kanban Board: offer a stage based board next to the timeline for the same tasks.
  • Event Calendar: show meetings and deadlines in a day, week or month calendar.
  • Todo App: give each person a simple list of the tasks assigned to them.
  • Stat Cards: add project totals such as open tasks, overdue items or team load.
  • Dashboard Shell: place the timeline inside a full app layout with navigation.

Accessibility

Sidebar rows in Gantt Chart 1 and 2 are focusable buttons that open the detail sheet with Enter, and the bars in Gantt Chart 3 are focusable popover triggers with an aria-label that names the project and person. Zoom buttons have aria-labels, the range toggles in Gantt Chart 1 and 2 are labeled “Timeline range”, and the task forms in Gantt Chart 2 link every FieldLabel to its input, select or date button. Status colors are always paired with a text label or badge.

Dragging bars needs a pointer, so the date pickers in the detail sheets and the shift buttons in Gantt Chart 3 act as keyboard alternatives. Consider adding htmlFor and matching ids to the select and date fields in the Gantt Chart 1 sheet and the Gantt Chart 3 dialog, and an aria-label to the client filter and range toggle in Gantt Chart 3.

Gantt Chart FAQ

A gantt chart is a timeline view of a plan. Every task, feature or booking is a horizontal bar placed against a calendar, so its start, end and length are visible at a glance, together with overlaps, milestones and the position of today.

They are complete planning screens built with shadcn ui components and Tailwind CSS on top of the Kibo UI Gantt component. Each block adds a toolbar, filters, dialogs and detail panels around the timeline, so you get a working roadmap, project schedule or team planner instead of a bare chart.

Plans fail on dates and dependencies more often than on individual tasks. A gantt chart makes overlaps, late work and upcoming milestones visible to everyone, which helps teams spot conflicts early and gives stakeholders an honest picture of when things will ship.

Use a gantt chart when dates and durations drive the work, for example a roadmap, a construction schedule or staff bookings. A kanban board is the better fit when the main question is which stage a task is in rather than when it happens.

Bars on a time scale grouped by team, phase or person, a line for today, milestones or release markers, a legend for status colors and a way to change the scale. Interactive charts also let people drag bars to new dates and open an item to edit its details.

The timeline lives in components/ui/gantt.tsx, adapted from Kibo UI. It imports @dnd-kit/core and @dnd-kit/modifiers for dragging, date-fns for date math, jotai for shared drag state, lodash.throttle and @uidotdev/usehooks, plus the shadcn Card and Context Menu components. The blocks themselves also use date-fns, and the date pickers rely on react-day-picker through the shadcn Calendar.

By dragging a bar, or its edges, to new dates. The onMove handler receives the item id with the new start and end and updates state. A click that moves less than 4 pixels counts as a click, so the same bar can still open its details. Gantt Chart 3 also offers buttons that shift a booking one week earlier or later.

A toggle group switches the scale between Daily, Monthly and Quarterly, and a button group changes the zoom in steps of 25 percent. Gantt Chart 1 zooms from 50 to 200 percent, Gantt Chart 2 from 50 to 300 percent and resets to a default zoom for each scale, and Gantt Chart 3 from 50 to 250 percent. After every change the timeline scrolls so today sits near the left third of the view.

In Gantt Chart 1 users hover the timeline header or open the Releases menu to add a release through a dialog, and remove one from that menu or by right clicking the marker. Gantt Chart 2 lets users remove milestones with a right click. Gantt Chart 3 shows its two milestones as fixed markers.

Yes in Gantt Chart 2 and Gantt Chart 3. Both pass onAddItem to the GanttProvider, so hovering an empty part of a row shows an add button that opens the Add task or Assign work dialog with that date filled in. Gantt Chart 1 adds features from the New feature button instead.

Each block reads its sample data from data.ts, where dates are stored as day offsets from today so the demo always looks current. Load your records instead, then call your API inside the handlers that already update local state, such as handleMove, createFeature, handleSave and submitAssign.
In Gantt Chart 2 a task is overdue when its end date is before today and its progress is below 100 percent. Overdue bars switch to the destructive color and show an Overdue badge. Overall progress is an average of task progress weighted by each task’s length in days, so long tasks count more than short ones.

For the current month Gantt Chart 3 counts weekdays, removes days of time off and multiplies by 8 hours to get capacity. Booked hours are the overlapping weekdays of each project times its hours per day. The load badge is outlined below 75 percent, secondary from 75 percent and destructive above 100 percent.

The timeline scrolls horizontally on every screen size. Gantt Chart 1 hides the 300px sidebar below 640px and prints team names above the bars, Gantt Chart 2 hides the sidebar below 768px, and Gantt Chart 3 keeps its people column but narrows it to 184px on small screens.

No. All three gantt chart blocks are part of All Access, the one-time license that also unlocks every other block, admin dashboard and template with lifetime updates.
shadcn gantt chart blocks
Unlock Premium Blocks & Sections
Premium blocks are part of All Access. One license unlocks the whole Shadcn UI Kit, so you can build complete pages and products instead of single sections.
  • 550+ blocks for landing pages, stores, dashboards and apps
  • 16 admin dashboards and 17 ready-made apps
  • 5 premium Next.js website templates
  • 560+ component variants and 70+ examples
  • Install with the shadcn CLI or from your AI editor through the MCP server
  • Lifetime updates, including every new block we release
Unlock Now

One-time payment, no subscription.