About Shadcn Stat Cards Blocks
A stat card is a compact dashboard tile that shows a key metric, such as revenue, signups or uptime, together with the context needed to judge it: a change against the last period, a target or a small trend line. These 33 shadcn stat card blocks range from a classic four card KPI row to interactive cards with period toggles, charts, meters and sortable lists.
Like the rest of our shadcn blocks, every card is built with React, TypeScript and Tailwind CSS on top of shadcn ui components such as Card, Badge, Toggle Group, Select, Tooltip and Chart. The sample data covers sales, finance, healthcare, logistics, DevOps and education, so you can start from a card that already speaks your domain. All shadcn components in these blocks use your theme tokens and work in light and dark mode.
Key Elements of a Stat Card
- Headline value: one large number that can be read at a glance, formatted with the right unit or currency.
- Clear label: a short name for the metric and, where it matters, the period it covers.
- Comparison: a change badge, a target line or a previous value that tells the reader whether the number is good.
- Visual cue: a sparkline, progress bar, meter or split bar that shows shape or proportion without a full chart.
- Controls: a period toggle, a filter or an actions menu when the card needs to answer more than one question.
Where and Why to Use Stat Card Blocks
Stat cards turn raw data into a short status report. They sit at the top of a page, give every visitor the same starting point and point to the area that needs attention. Because these blocks reuse the same shadcn components as the rest of your app, a KPI row looks consistent next to tables, charts and forms built with shadcn ui and Tailwind CSS.
- SaaS admin dashboards: revenue, orders, active users and plan usage at the top of the overview page.
- Finance and billing views: transfers, account activity, cloud spend and card limits.
- Operations and DevOps: deploy success, release calendars, cluster capacity and fulfillment hubs.
- Healthcare and services: admissions, wait times, show rates, follow-ups and technician rosters.
- Education platforms: learner engagement, funnels, survey results and course goals.
- Team and project tools: sprint progress, hiring metrics and benchmark comparisons.
Stat Card Blocks in This Collection
KPI rows and card grids
- Stat Card 1: A safe default for the top of any admin overview when you need four headline numbers with a quick month over month comparison.
- Stat Card 5: Use it to compare regions or teams against their goals, since each card links through to a detail page.
- Stat Card 6: Fits a billing or account page where users need to see how much of their workspace or dashboard quota is taken.
- Stat Card 7: Good for API products and usage based plans that must warn customers before they reach a limit.
- Stat Card 8: Built for trading, portfolio or price watch screens where the recent trend matters as much as the current price.
- Stat Card 11: A dense full width strip for operations teams that track many metrics where some should go up and others should go down.
- Stat Card 13: Suits recruiting or HR dashboards that compare the same KPIs across different time windows.
- Stat Card 20: Choose it when each metric belongs to a person, such as field staff, agents or account managers you assign work to.
- Stat Card 27: Helpful for sustainability or facilities reports that measure one site against regional or national peers.
- Stat Card 32: Pairs two related outcome metrics side by side, which works well for clinics and service teams that review weekly trends.
Breakdowns and proportions
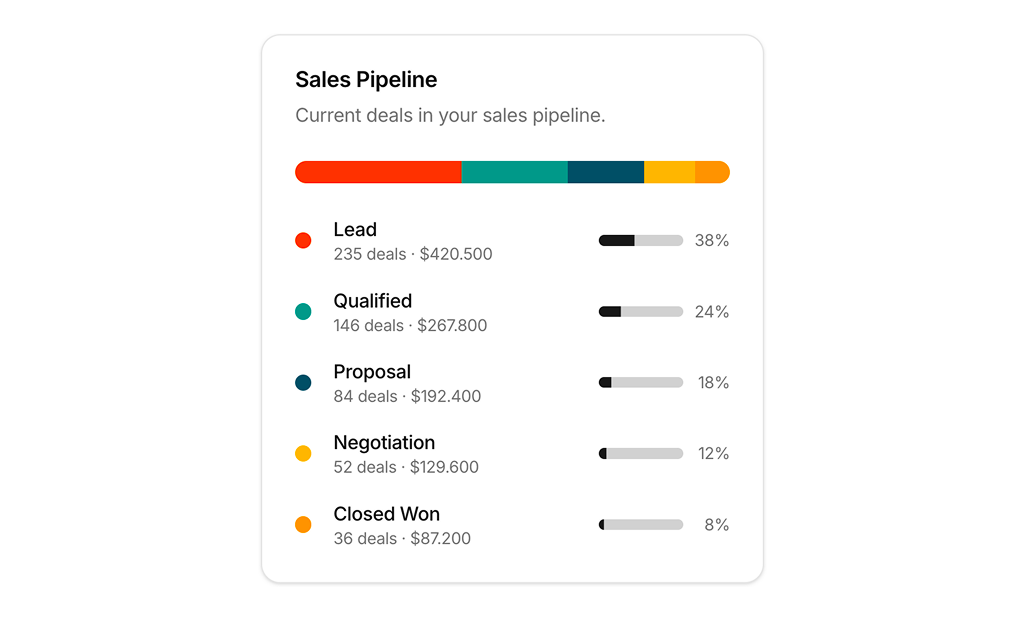
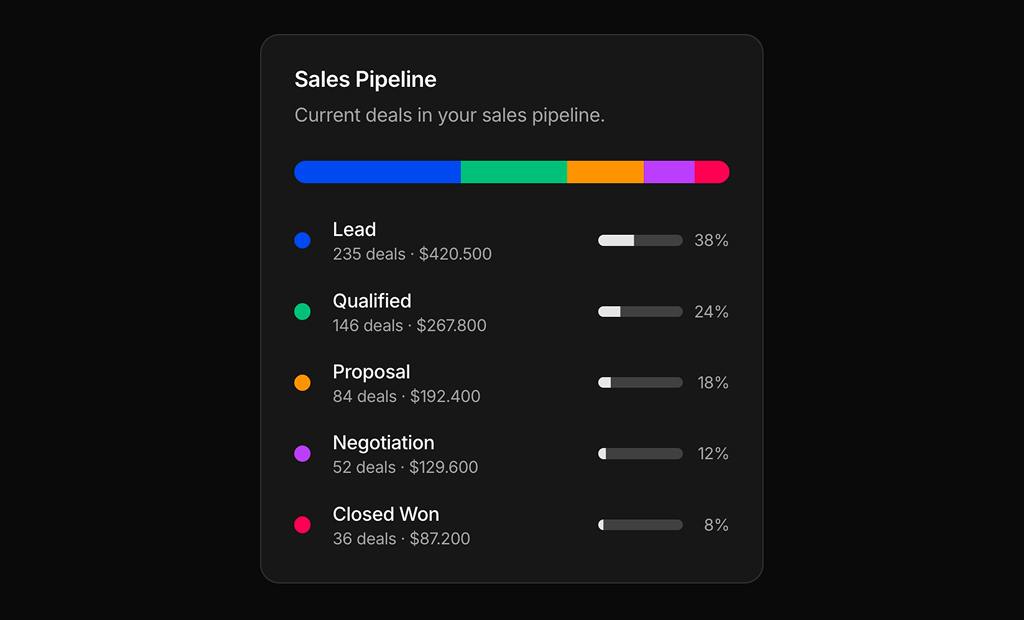
- Stat Card 2: Shows where deals are stuck in a CRM pipeline, so sales managers can see the drop between stages at a glance.
- Stat Card 3: A lightweight summary for marketing sites or small analytics widgets that only need a handful of traffic numbers.
- Stat Card 4: Works as a simple revenue tile when one total and a two part split tell the whole story.
- Stat Card 9: Made for energy or resource dashboards that compare two sources per quarter across several locations.
- Stat Card 16: Lets finance and platform teams see which cloud service drives the monthly bill.
- Stat Card 21: Ideal for retail and ecommerce reports that weigh online, marketplace, store and wholesale revenue against each other.
- Stat Card 25: Gives engineering teams a sprint status that shows every single issue rather than an abstract percentage.
- Stat Card 33: Use it for course platforms that want to show how many learners drop off between enrollment and certification.
Charts, meters and timelines
- Stat Card 10: Fits logistics dashboards where daily volume and the share of delayed or returned items both matter.
- Stat Card 19: Good for infrastructure pages that need to flag a cluster before it runs out of reserved capacity.
- Stat Card 22: A compact reliability tile for CI or deployment dashboards that track a daily rate against a service target.
- Stat Card 23: Rates a percentage on a scale from poor to great, which suits booking systems, clinics and any metric with quality bands.
- Stat Card 24: Works for production or output metrics where the total, the daily average and the best day all need to be visible.
- Stat Card 26: Suits health, fitness or wellbeing apps that compare a daily score with a personal baseline.
- Stat Card 29: Lets API and platform teams compare this week with last week for each region in one view.
- Stat Card 30: Shows release cadence over a quarter like a contribution graph, handy for engineering reviews and team retrospectives.
Lists, tables and workflow cards
- Stat Card 12: A good overview card for a single survey, form or campaign that is still collecting responses.
- Stat Card 14: Fits banking and wallet apps that show the day's money movement before the full transaction history.
- Stat Card 15: Use it as a short ledger on an account page where users want to sort and filter recent activity without leaving the dashboard.
- Stat Card 17: Built for expense and corporate card tools where admins adjust a shared budget and need to know if spending is on pace.
- Stat Card 18: A ranked table for warehouse or fulfillment operations that compare several locations on service level and capacity.
- Stat Card 28: Tracks several goals for one group, such as a course cohort, and counts how many of them are on track.
- Stat Card 31: Suits document and compliance workflows where one file moves through several review stages.
Similar Block Categories
- Charts: add full size charts below the KPI row when readers need more detail.
- Tables: list the records behind a number, such as the orders or tickets a card counts.
- Dashboard Shell: place the stat cards inside a sidebar and header layout.
- Empty State: show a helpful message while a metric has no data yet.
- Stats: the marketing version, with big numbers for landing pages instead of dashboards.
Accessibility
Several cards expose their visual data to assistive technology. The capacity meters in Stat Card 18 and Stat Card 19 use role="meter" with aria-valuenow, the segmented bars in Stat Card 16 and Stat Card 25 have a role of img with an aria-label that lists every share, and the star rating in Stat Card 20 is labeled as a value out of five. Detail text that changes on interaction, for example in Stat Card 14, Stat Card 19, Stat Card 22, Stat Card 30 and Stat Card 33, sits in an aria-live region. Toggle groups, selects and icon only buttons carry aria-labels such as “Comparison period” or “More options”, and the progress bars have their own labels.
Interactive bars and dots are real buttons or toggle items, so the day bars in Stat Card 22, the calendar dots in Stat Card 30 and the channel columns in Stat Card 21 respond to keyboard focus as well as hover. Some details still rely on hover only, such as the per tick value in Stat Card 19, so consider repeating important numbers in text. Changes are shown with a sign and an arrow icon next to the green or rose color. Bars and markers animate with CSS transitions, and you may want to wrap them in motion-safe variants for visitors who prefer reduced motion.
Stat Cards FAQ
npx shadcn@latest add @shadcnuikit/stat-card1. The other 32 stat cards are part of All Access.recharts through the shadcn Chart component. Install the recharts package and the chart component before you add them.stats in Stat Card 1, metrics with values per period in Stat Card 11 and Stat Card 13, and transactions in Stat Card 15. Replace those constants with data from your API. Stat Card 10 and Stat Card 24 generate sample series with a seeded function that you can delete once real data is in place.lowerIsBetter flag per metric, so a shorter ER wait or a lower readmission rate shows a green badge. Stat Card 32 uses a higherIsBetter flag for the same purpose, Stat Card 16 colors a drop in cloud spend green, and Stat Card 27 treats values below the peer median as efficient.bg-primary, bg-chart-2 or var(--chart-5), so they follow the colors in your globals.css. Change those variables to restyle every card at once. Positive and negative changes use green and rose utility classes, and Stat Card 8 sets its chart colors as HSL values in the component, so edit those directly.